
Investment Advisory — Research
Choosing risk with eyes open: how we build a strategic allocation.
Before a single fund is chosen, one decision fixes most of what follows: how much risk to take. Most investors make it half-blind — anchored to a peer’s portfolio or a banker’s standard profile. We make it a decision with its consequences in full view.
Ask a board why their portfolio holds 40% equities and the honest answer is often “that’s what it held when we arrived”. Yet the split between safe and risky assets — the strategic asset allocation — will determine the portfolio’s outcome far more than any fund selection or market timing that follows. A decision that important deserves better than inheritance. Our process puts it on three legs: know what the money must do, model the world honestly, and choose from alternatives you can actually compare.
Start with the money’s job, not the markets
The first step contains no market data at all. It is a study of the institution itself — what practitioners call asset-liability management, and what is really three questions in plain language. How much cash must be available, and when? A foundation that pays grants every autumn has a hard cash need that a family endowment does not. How long can the rest stay invested? Money needed in three years and money needed in thirty are different substances and should be invested differently. And how much loss can the institution bear — not only financially, but in the boardroom, where a paper loss becomes pressure to sell at the worst moment?
The answers become written boundaries before any optimisation runs: a floor on cash, a ceiling on illiquid holdings, bands around every asset class. The boundaries do the quiet work of ensuring that whatever the models later suggest, the portfolio can always pay the grants, weather the meeting, and hold its course.
Honest inputs, granular building blocks
Projections are only as good as their assumptions, so we refuse to rely on a single house view. Expected returns start from the published long-term assumptions of the major institutional houses — a consensus, not an opinion — and are completed by our own documented estimates only where no consensus exists: catastrophe bonds, listed infrastructure, private markets, trend-following strategies. Each of those own estimates carries a written rationale and named sources, reviewed annually.
Two Swiss adjustments matter enough to mention. Returns quoted in dollars or euros are translated into francs — hedged asset classes lose roughly the cost of the currency hedge, unhedged ones a discount for the franc’s long habit of strengthening. And every projection is net of fees. A gross-of-fee simulation is a small dishonesty that compounds for ten years.
The building blocks are deliberately granular: not “bonds” but Swiss government bonds, global investment grade, high yield, catastrophe bonds — each with its own behaviour. Coarse categories hide exactly the differences an allocation is supposed to exploit.
Assets hold hands in a storm
Diversification has fine print. Correlations measured in calm markets flatter the picture: when a crisis arrives, assets that normally go their own ways fall together — they hold hands and jump. The textbook simulation model (the bell curve of finance courses) is structurally incapable of producing this behaviour, which is precisely why it makes portfolios look safer than they are.
So we fit a model that can. Without leaning on the mathematics — the tool is called a copula, fitted to twenty years of market history — its purpose is simple: it lets the simulation reproduce the tendency of markets to crash together more violently than they rally together. The difference is not academic. For a representative balanced portfolio, the textbook model put the chance of losing money over ten years at 9%; the realistic model put it at 12%. For the severe outcomes the gap widens dramatically: a one-in-a-hundred ten-year loss of 18% under the textbook model becomes 36% under the realistic one — twice as deep. The textbook would have told the board a comforting story. We prefer the true one.
Five allocations, a thousand decades each
The final step is deliberately theatrical: we do not present one recommended allocation, we present a ladder of five — from too cautious to too bold — because a choice only makes sense against its alternatives. For each allocation, the simulation plays out a thousand possible decades, asset class by asset class, and we look at where CHF 100 ends up.
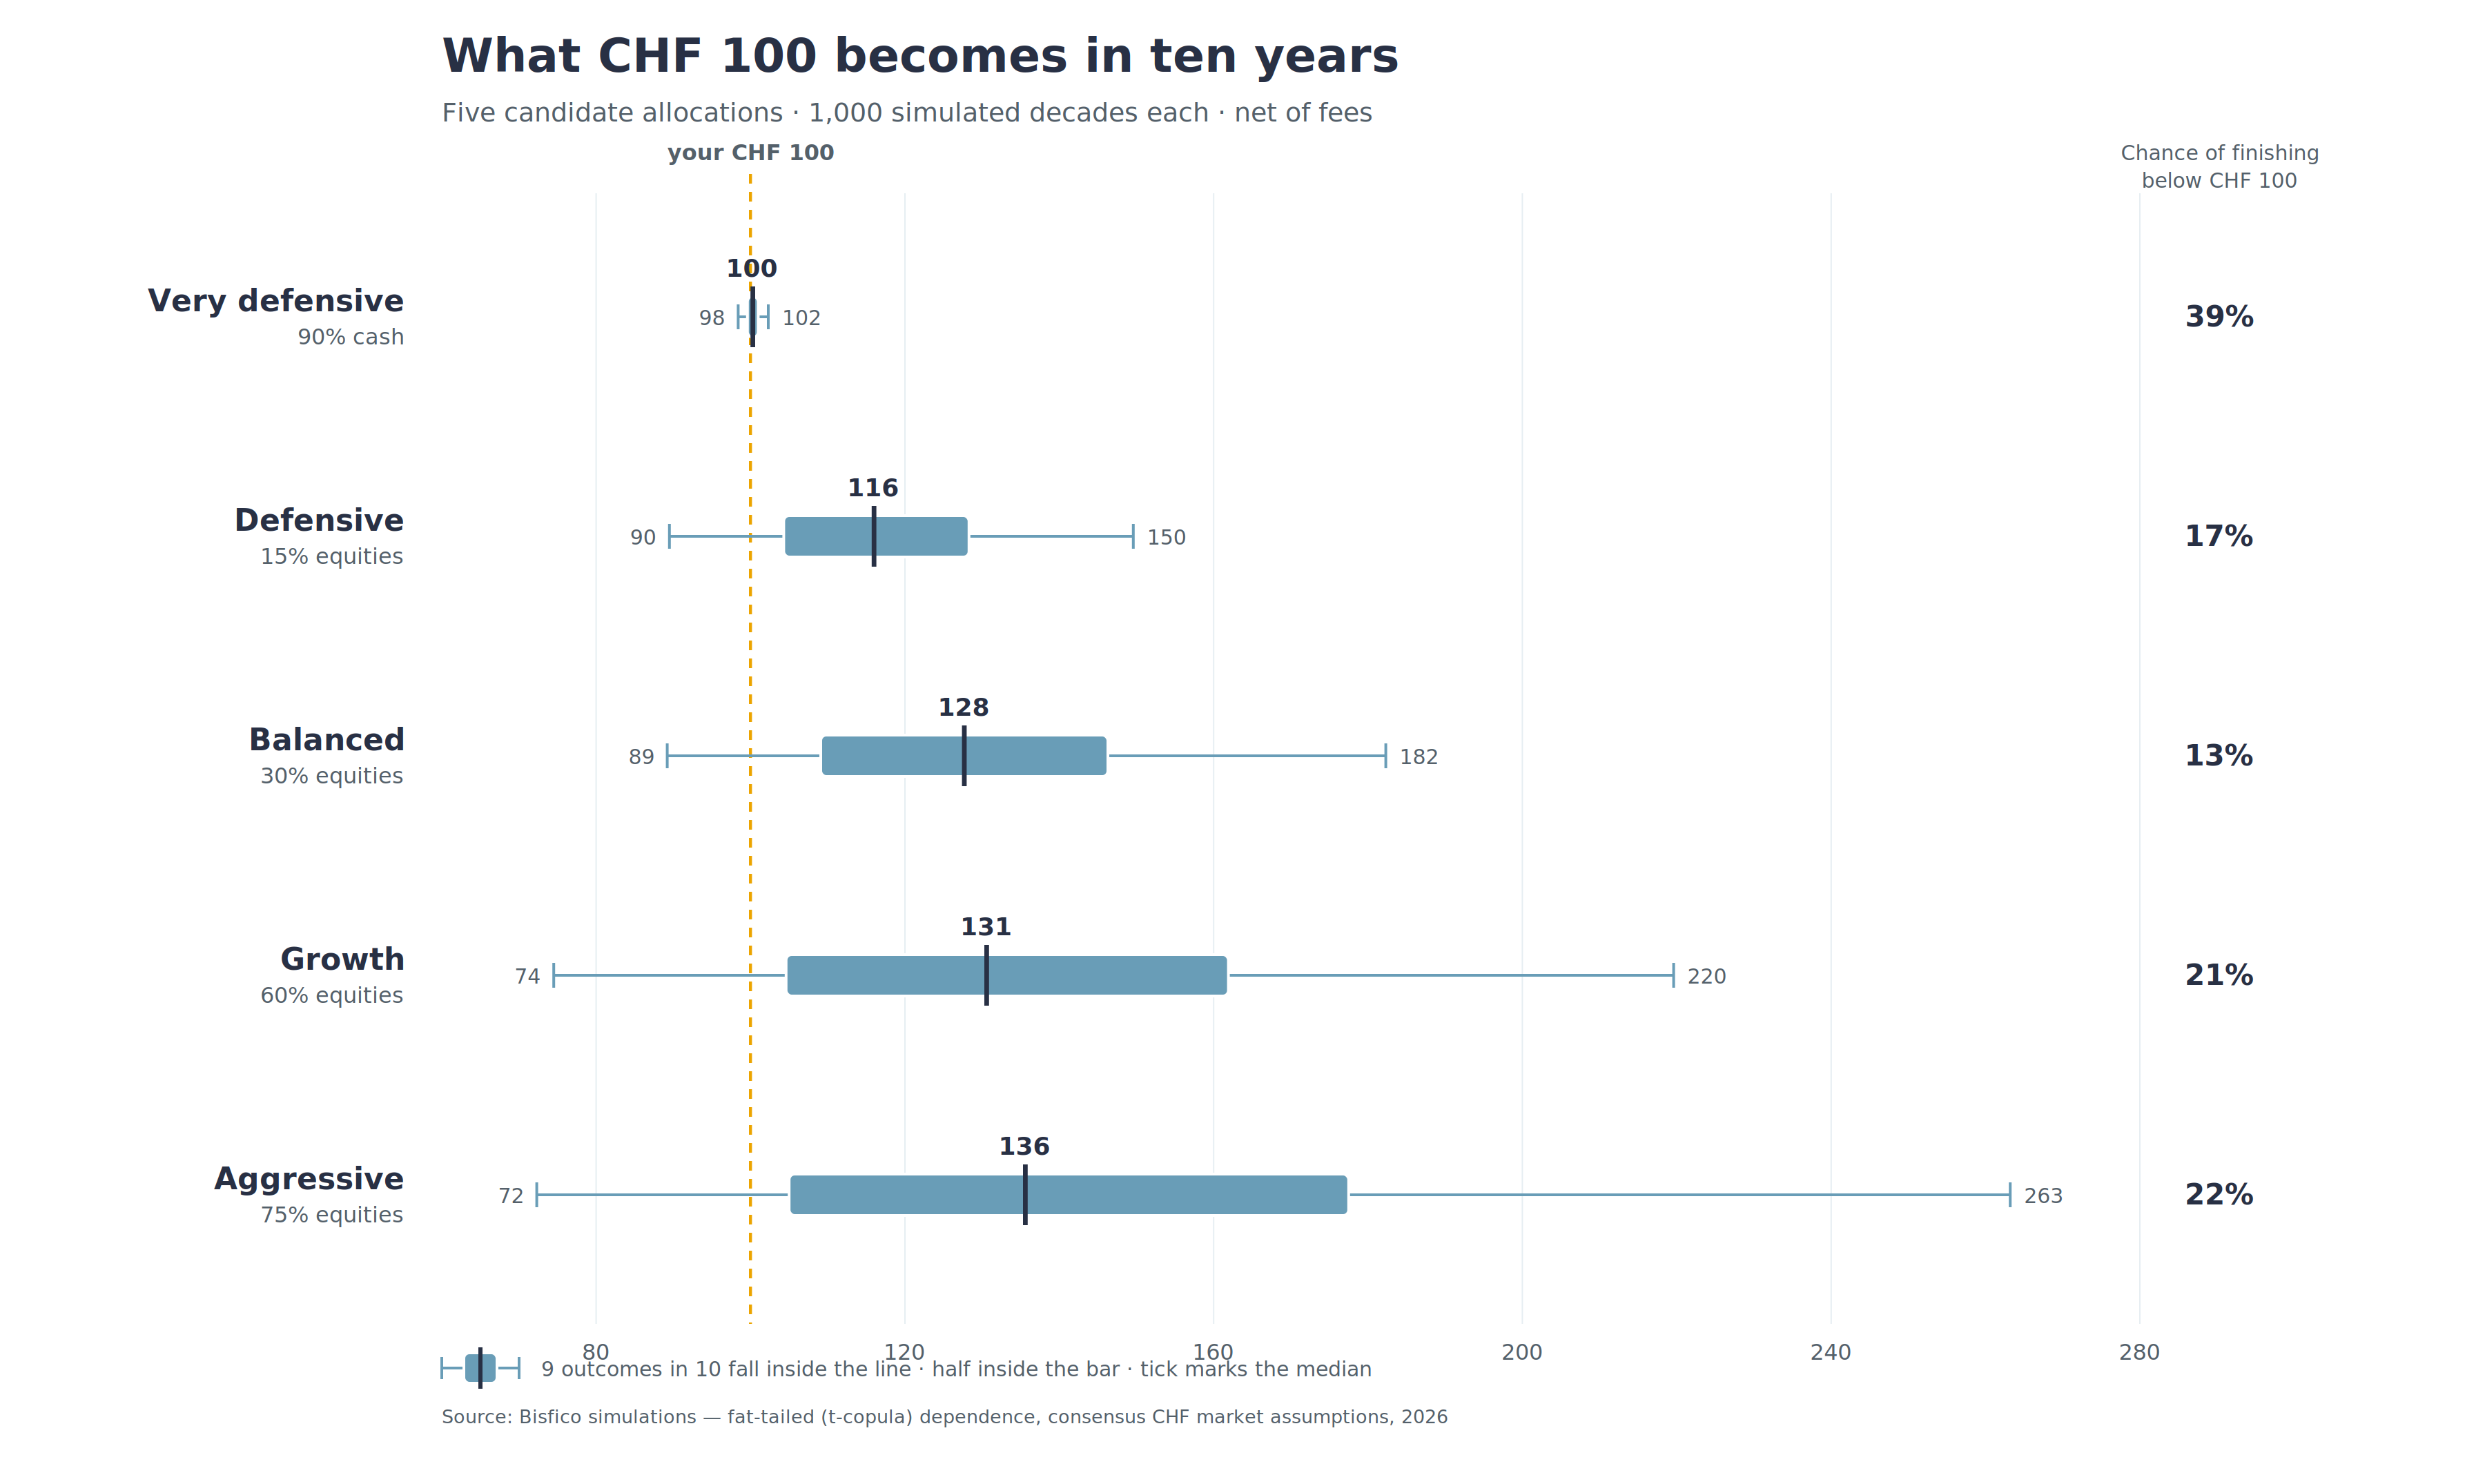
The chart repays a slow read, starting with its most counterintuitive line. Swiss franc cash, net of fees, carries a negative expected return — which makes the “safest” allocation the one most likely to lose money. The 90%-cash allocation has a 39% chance of finishing below its starting value, three times the Balanced allocation’s 13%, and it offers nothing in exchange: across a thousand simulated decades its best outcomes barely reach CHF 102, before inflation has taken its share. Every other allocation buys its chance of loss with a real prospect of gain; cash accepts the chance of loss and skips the prospect. Judged the way a decade should be judged — by the odds of failing to preserve capital — cash is hands down the riskiest asset on the chart. Its one virtue is that its losses are shallow: it loses often, but politely. The distinction a board needs is between losing often and losing badly — cash specialises in the former, equities in the latter, and only one of the two pays you for the discomfort.
The rest of the ladder has its own arithmetic. The step from Defensive to Balanced is the bargain: the median outcome rises from 116 to 128 with essentially no deterioration in the bad scenarios — that is diversification actually earning its keep. Beyond Balanced, the terms worsen: moving to Growth lifts the median by only three francs while the worst-in-twenty outcome drops from 89 to 74, and the aggressive allocation buys a seductive right tail — a one-in-twenty chance of 263 — at the price of the deepest losses and a one-in-five chance of going backwards.
Nothing in the chart says which allocation is correct; that is the point. The right allocation is where the boundaries from the first step — the cash needs, the horizon, the bearable loss — meet a distribution the board can look at and accept. Different institutions will land on different allocations from the same chart, each for reasons they can now articulate.
From decision to discipline
The chosen allocation is then written down: target weights, bands around them, rebalancing rules, all anchored in the investment policy. From that point the work is discipline, not prediction — rebalance when bands are breached, revisit the study when the institution changes, and resist revisiting it merely because markets wobble.
We cannot promise a return; nobody honestly can. What we can promise is that the risk was chosen — not inherited, not defaulted into — with its consequences in full view, so that when the bad year eventually comes, it surprises no one for the wrong reasons.
Simulations: Bisfico portfolio construction engine — fat-tailed (t-copula) dependence fitted to 20 years of market history, consensus capital market assumptions in CHF (2026), 1,000 paths over 10 years, net of fees. Optimisation and covariance estimation via Portfolio Optimizer.